Chris Vermeulen
Technical Analyst & Market Forecaster | The Technical Traders | Precious Metals & Energy Specialist
"Contrarian precious metals timing and technical analysis of gold-dollar-oil relationships"
Biography
Chris Vermeulen is a technical analyst and market forecaster who specializes in precious metals, energy markets, and broad market timing through chart analysis. As the founder of The Technical Traders, he provides market analysis and trading insights with a particular focus on gold, silver, and oil markets.
Vermeulen is known for his contrarian approach to precious metals investing, having notably exited gold positions around $5,200 and silver around $113 during what he identified as a euphoric FOMO-driven top reminiscent of 2011. His analysis combines technical tools such as Fibonacci extensions and retracements with broader macroeconomic themes, particularly focusing on currency dynamics and their impact on commodity prices.
His investment philosophy centers on capital preservation and strategic positioning ahead of major market moves. Vermeulen frequently warns of potential financial resets and maintains that gold serves as a key indicator of underlying monetary system stress. He advocates for maintaining significant cash positions during uncertain market conditions, often recommending 70% cash allocations while waiting for clearer technical signals.
Vermeulen's work focuses heavily on the interplay between the US dollar, oil prices, and precious metals, believing that dollar strength can create significant pressure on gold prices. His analysis suggests potential 10-15% rallies in the dollar could coincide with corrections in precious metals, making his timing-focused approach particularly relevant for commodity investors seeking to navigate volatile market cycles.
Videos (35)

Chris Vermeulen: Gold Could Drop To As Low As $3,100
- Top takeaway Chris argues gold has rolled from a euphoric blow-off top into a stage-4 bear market, with a Fibonacci measured-move target of $3,600 - about a 12% further decline - and a possible extension down to $3,100.
- He reads a new major bull market in Treasury yields, with the 10-, 5- and 30-year charts technically pointing above 8%, and warns the breakout could become a major headwind that eventually starts a bear market in equities.
- He says TLT is down about 56% and could fall another 20-30%, possibly to around $60 a share, so investors trying to pick the bottom are still early.
- He is positioned in equities - long the S&P 500 (expecting an 8-10% move) and the NASDAQ, with one 2X strategy up almost 50% - because money is flowing into stocks and Bitcoin rather than precious metals.
- He sees silver in the same bear market with a $39-$40 per ounce target and says a potential ~17% dollar rally could force panic liquidation in metals - a sharp, short drop he plans to buy for a 5-15 year horizon.
Technical analyst Chris Vermeulen says yield charts point toward 8% on the 10-year Treasury, a headwind he expects for stocks, real estate, and bonds. He sees gold in a bear market targeting $3,600 and possibly $3,100, with silver pointing to roughly $39 an ounce. The long bond ETF TLT is down 56%, and Vermeulen warns bottom-pickers it could fall another 20-30% as yields climb. Vermeulen expects a stronger dollar and forced margin-call selling to drag metals lower, a sharp drop he plans to buy. Vermeulen is positioned in equities and Bitcoin, not metals, arguing the key is owning whichever asset class money is flowing into.

Precious Metals Warning: Gold Targets $3,600 While Bitcoin Turns Bullish | Chris Vermeulen
- Top takeaway Argues gold has broken down below its 150-day moving average in a stage-3 topping phase and, as of the early-October 2026 recording, targets $3,600 and possibly $3,100 if gold closes below support near $3,900 for a day or two.
- Sees money rotating into equities and Bitcoin instead of precious metals, with the QQQ set for about 3% and then up to roughly 14% more upside on bull-flag Fibonacci targets, in a move he warns could be an exhaustion rally before the market peaks.
- Says Bitcoin has entered a new bull market on his stage analysis, having bottomed with bullish price action and returning money flow, and targets about $95,000, roughly a 9% gain from the recording date.
- Reads TLT's October 1 exhaustion gap as setting up a bounce to around 80-81 as yields pull back, but calls it a bounce within a downtrend and says he would not trade it.
- Warns against holding through dormant decades, citing gold's 45% fall and 13-year recovery and silver's 72% drawdown, and says he runs a 5-to-12 ETF rotation portfolio, sharing every position with subscribers.
Technical analyst Chris Vermeulen argues gold has broken down, targeting $3,600 — possibly $3,100 — if support near $3,900 gives way. An October 1 exhaustion gap (panic selling ending a move) in bonds suggests falling yields and a TLT bounce, though the bond downtrend remains. He sees money rotating into equities and Bitcoin, which stage analysis (reading trend via moving averages) says has turned bullish, targeting about $95,000. He maps Nasdaq upside with Fibonacci measured moves (about 3% near term, 14% potential) that an Anthropic IPO could ignite, pulling capital from metals. His lesson: a strong fundamental story never guarantees price — gold once fell 45% and silver 72%, each taking 13-plus years to recover.

Yields Skyrocketing to 8%? Silver Could Collapse! | Chris Vermeulen
- Top takeaway The guest says the 5-, 10- and 30-year Treasury yields all show the same chart pattern pointing to about 8%, with the 10-year at 8.25%, and argues this could spark a financial crisis.
- He places gold and silver in a stage-four decline, with gold pointed at roughly $3,600 and then $3,100, and silver at about $36 an ounce, a further 35-40% drop or roughly 70% off the peak.
- He says he is long the S&P 500 and Nasdaq 100 and sees about a 15% Nasdaq rally if the index breaks to all-time highs, with AI, semiconductors and the Magnificent Seven doing the heavy lifting.
- He expects yields to pause or pull back over the next one to three weeks, which would ease the dollar and give metals, miners and equities a short bounce.
- He is holding almost no precious metals, saying he will not leave life savings dormant in a downtrend for five to ten years and prefers to accumulate on the way down toward his targets.
Chris Vermeulen sees three separate Treasury yield curves — 5-year, 10-year and 30-year — all pointing toward 8%. He expects rising yields to hit real estate, dividend stocks and levered households, bringing layoffs, bankruptcies and foreclosures. Near term he stays bullish on the NASDAQ and S&P 500, seeing roughly 15% upside if AI names drive an all-time-high breakout. Four-stage analysis (base, bullish, top, decline) puts gold and silver in a decline: gold toward $3,600-$3,100, silver toward $36-$40. His rule is to hold what is rising and exit what is falling, rather than sit through a multi-year pause in a favorite metal.

Gold Rally in Danger? Chris Vermeulen Reveals His “Screaming Buy” Zone | Sprott Money
- Top takeaway The guest argues gold is sending mixed signals: the short-term trend is up but the 150-day moving average is still sloping down with a pattern of lower highs and lower lows, so he is sitting on hands and waiting for confirmation before putting fresh capital into physical metal
- If gold has bottomed, Fibonacci extensions point to roughly $7,900 to $8,000 as the next stop on a multi-year bull market; if it rolls over instead, the 50% retracement near $3,600 is what he calls a 'screaming long-term buy'
- Miners (GDX) are leading gold: they have already broken two significant prior highs with a strong impulse wave, while gold itself has not yet broken its matching high, which the guest reads as money rotating into the leverage play ahead of the metals
- Silver is lagging the rest of the complex, stuck just below the ~$75 pivot and resistance zone and still below its 100-day moving average; he frames silver as a potential late bloomer that could suddenly catch up to gold and copper
- He cautions the move could still be a bear-market or sucker's rally, stresses patience over emotional trades, and prefers to track physical gold pricing because he considers it the most trustworthy and stable reference
Vermeulen flags $3,600 as a deep long-term gold buy zone if prices pull back further. Gold and miners are in a short-term uptrend, but the long-term 150-day moving average still slopes down — mixed signals persist. Miners (GDX) broke out roughly a month before gold itself, with three significant highs cleared, signaling momentum. Silver is stuck below the $75-$76 resistance zone and has yet to take out its 100-day moving average. A potential bear-market bounce is the base case until a confirmed breakout to $8,000 arrives.

The 30-Year Yield Warning Investors Should Watch
- Top takeaway The guest argues that yield charts are pointing to dramatically higher pricing, which he believes could trigger a financial crisis affecting countries, companies, the stock market, and the housing market.
- He notes that the 30-year yield has been above 5% for roughly 45 days this year, a duration last seen in 2007 just before the major financial crash and reset, though he stops short of predicting a repeat.
- He observes that fear is creeping up and holding at elevated levels amid significant uncertainty in the markets.
- He points to interest rate charts signaling 8% on the 30-year and slightly above 8% on the 10-year as a potential trajectory.
- He warns that if those rates materialize, bonds would get absolutely annihilated and a financial crisis would unfold where investors would not trust anything.
Chris Vermeulen warns the 30-year yield has stayed above 5% for roughly 45 days — a stretch last seen ahead of 2007's crash. His yield-curve charts point toward roughly 8% on the 30-year and slightly above 8% on the 10-year. He argues that if long yields reach those levels, bonds will be annihilated and broader markets risk a cascading crisis. The 2007 parallel is offered as a warning pattern, not a prediction that history will repeat.

Chris Vermeulen: Why This Gold Breakout Could Fail
- Top takeaway The guest's core call: gold, silver and miners are still in a bear market technically, and today's big rally is a countertrend bounce that could peak out and roll back down within days.
- He argues the only bullish setup is a sustained break of two prior standout highs on miners like GDX, followed by a higher low that can be bought; otherwise he wants to wait for the 20-day to cross above the 50-day.
- On equities he says the S&P 500 is in 'full bull mode' with Fibonacci targets implying roughly 10% upside to about 847 on SPY (around 8,500 on the index), and he expects a 2021-style euphoric blow-off before a larger correction.
- He describes his 'asset investing' approach: only hold assets that are trending up, trade ETFs (including 2X funds) via rules-based signals, target 5-12 trades a year of 3-8% each, and use physical metals separately as a long-term insurance position.
- On yields and TLT he warns the 30-year chart is pointing to about 8% - reminiscent of 2007 - which would mean a financial crisis and TLT roughly halving; on copper he is bullish, with a Fibonacci target near $738 and miners setting up a large bull flag.
Gold's recent breakout is technically a bear-market bounce, not a new bull trend — moving averages still slope down and price needs to confirm. The broader market is in full bull mode; the S&P 500 may run 10%+ higher toward 8,500 as money rotates from Big Tech into equal-weighted stocks. Copper is bucking the broader metals downtrend, hitting all-time highs with bullish miners and AI demand supporting the move. Long-term bonds (TLT) remain in a clear downtrend; the 30-year yield above 5% last appeared just before the 2007 financial crisis. Silver can drift to $70-$75 and gold to $4,500 within this countertrend rally before hitting heavy overhead resistance.

🚨Gold Miners Are Still Bearish - Chris Vermeulen Warns #shorts
- Top takeaway Vermeulen argues gold miners are still technically in a bear market, with the long-term trend sloping down and price trading below key moving averages as of the August 2026 clip
- He emphasizes the 50-day moving average is sloping down with the 20-day below it, which he reads as confirmation of a strong, ongoing downtrend in the gold miners space
- He flags a small bullish crossover signal: the 5-day moving average has just crossed above the 20-day line
- He suggests this short-term trigger could set up a quick upside pop for momentum traders, even while the broader trend remains bearish
Gold miners remain in a strong technical downtrend despite a brief short-term momentum signal from a 5-day/20-day moving average crossover. Chris Vermeulen argues the 50-day moving average still slopes downward, confirming bearish pressure outweighs any near-term bounce. Traders watching for short-term pops can use shorter moving average crossovers even within broader bearish trends, per Vermeulen. The discussion focuses purely on technical signals — moving averages filter out fundamentals and emotions to reveal the underlying trend.

Gold and Silver Face a Dangerous Turning Point as Stocks Surge | Chris Vermeulen Warns
- Top takeaway Argues the recent bounce in gold, silver and miners is a counter-trend pause inside a bear market, not a new bull market, and warns it could end in a bigger sell-off once the equity rally stalls.
- Says the US dollar has technically entered a bull market since bottoming in January 2026 and is holding support in the 99 range, which he expects to cap precious metals over the next month or two.
- Expects one final blow-off phase in equities, with Fibonacci extension targets of roughly 8% more for the Nasdaq 100 at the 618 golden ratio and about 18% at the full measured move, which he says could catch traders betting on a decline off guard.
- Reports his band strategy has been long the 2x Nasdaq ETF (QLD), up almost 40% from entry as of the August 4, 2026 recording, and that his SPY position hit a first target that day, prompting him to trim some exposure.
- Would only turn positive on precious metals after a strong impulse move breaks two significant highs and turns the 20-day, 5-day and 50-day averages up, and says he plans to accumulate physical metals only when he believes the next big rally is starting.
The guest reads the US dollar as having entered a technical bull market after its January bottom, likely capping gold and silver. The metals bounce is a counter-trend rally inside a downtrend, the guest argues, with gold miners still technically in a bear market. Confirmation to turn bullish requires gold, silver, and miners breaking prior significant highs so the 50-day and 20-day moving averages turn up together. A broadening stock rally — money rotating out of big tech and AI into equal-weighted and small-cap stocks — signals investors still want risk. Fibonacci extensions (measured-move price targets) suggest the stock rally could run another 8-18%, surprising investors betting on a decline.

Silver Pointing To $39/oz! Here's What You Need To Know | Chris Vermeulen
- Top takeaway Vermeulen's top call as of July 27, 2026 is that silver's second leg down is still ahead, with his Fibonacci extensions pointing to about $39.40/oz — the roughly $40 target he has held since his last appearance on the show.
- For gold, he says the first measured drop already completed and, with price at the 61.8% level, the 100% measured move near $3,500-$3,600 comes next — a breakdown few expect, which he believes could spark panic selling.
- He argues gold and silver are already in a bear market: the 150-day moving average is sloping down with price below it and both metals have corrected well over 20%, so the talked-up double bottom is likely just a technical bounce in a bear flag.
- He sees the washout catalysts lining up: the Nasdaq/QQQ topping as the AI bubble fizzles, a US dollar breakout that looks like a new bull market, and the Strait of Hormuz war driving oil toward about $112, feeding inflation and potentially higher interest rates.
- Long term he remains extremely bullish, seeing gold eventually working toward $8,000-$12,000 and the washout as the entry point, but for now he is heavily in cash, still holds some equities and utilities while their trends are up, and will buy inverse ETFs only once his longer-term systems turn down.
Technical analyst Chris Vermeulen argues silver's Fibonacci extensions (chart targets drawn from an earlier drop and bounce) point toward $39-40 per ounce. Gold already finished its first drop; the guest sees a 100% measured move (the initial decline repeating) targeting $3,500-$3,600. A topping stock market, a strengthening US dollar, and rising oil from the Strait of Hormuz war could trigger the metals washout. Both metals are in a bear market on the guest's measures, with price below a falling 150-day moving average, so he holds cash. He expects the eventual panic selling to create one of the best long-term buying opportunities for precious metals in years.
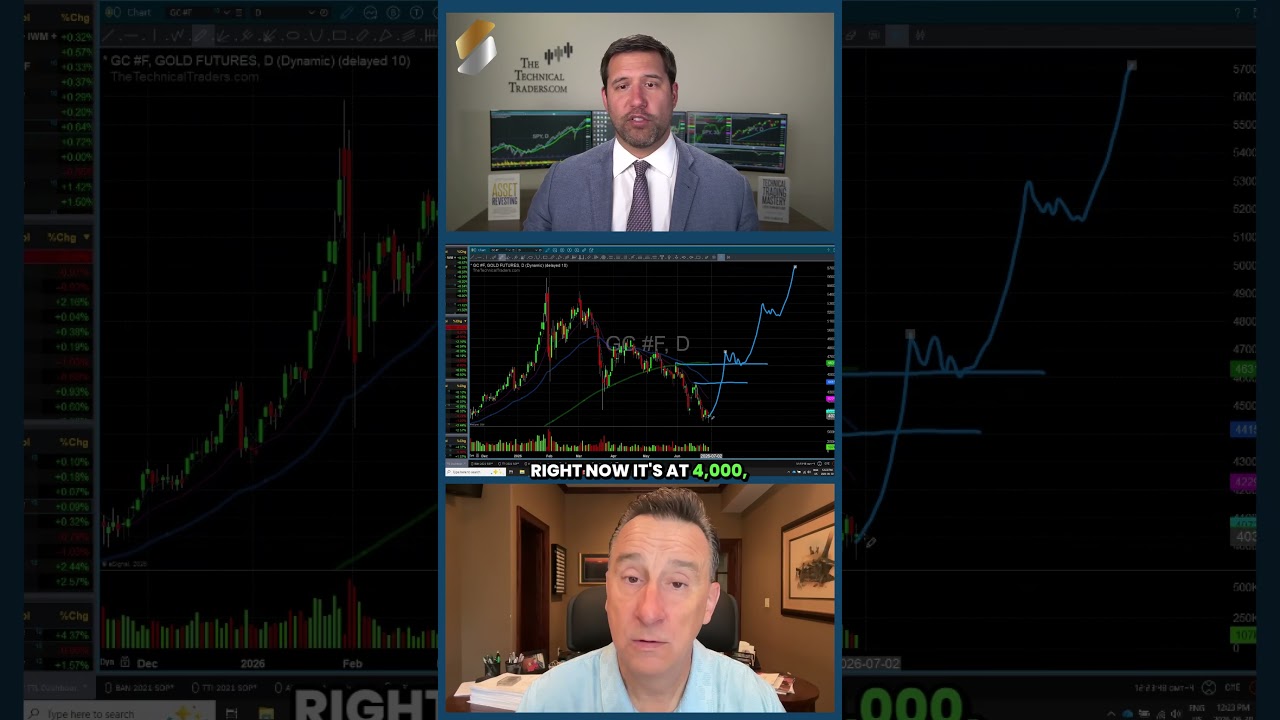
🚨 Gold's Next Move: Impulse Breakout - Chris Vermeulen #shorts
- Top takeaway Argues gold needs a strong impulse move through two resistance levels — about $4,600 versus roughly $4,000 as of July 4, 2026 — to confirm its next major breakout.
- Would treat the first pause and pullback after that breakout as a buying opportunity before the next run higher, expecting bull-flag patterns to repeat.
- Says clearing the prior highs would flip momentum from a downtrend of lower highs and lower lows to a higher high, with a higher low then needed to confirm the turn.
- Believes gold's next major move will be significantly higher once the breakout sequence turns up.
Chris Vermeulen argues gold flips bullish once a powerful impulse (a strong directional surge) breaks two resistance ceilings and prints a higher high. After breaking out near $4,600, the first pause and pullback usually offers an entry point before gold's next big run. Breakouts tend to repeat through bull flags (brief consolidations that continue a trend), so investors should expect pauses, not straight lines. Gold sits near $4,000 and needs about $4,600 to break out; the speaker expects the next move significantly higher.

Silver’s Next Big Run May Take Patience
- Top takeaway Vermeulen says he exited silver around $111, re-entered near $63, and as of July 2026 targets a first upside gain of about 200% followed by a range around 300%.
- He argues any silver pullback is temporary and that buy-and-hold investors, used to commodity volatility, can ride it out and add to positions.
- As an active investor, he says he sells near peaks when assets look overvalued and buys back only when the next big run is ready to start.
- He calls silver's chart the most beautiful he has seen and thinks people should be excited about the setup.
Vermeulen expects any silver pullback to be temporary, with a first upside target of a 200% gain and a later range near 300%. He contrasts buy-and-hold investors who ride out silver's volatility with active investors who sell near peaks and re-enter before the next run. Drawdowns are routine for commodities in his view, so weakness can be a chance to add rather than a reason to sell.

🚨 Silver to $40 Before the Next Rally? Chris Vermeulen Explains #shorts
- Top takeaway Vermeulen's Fibonacci analysis of silver points to a sharp drop toward about $40 per ounce, which he views as a buying setup he is watching for as of July 2026.
- He expects a market event and margin calls in the silver space to drive a very sharp, short-lived sell-off.
- He argues any tag of the $40 level could last only minutes or hours before silver rebounds back into the $60 range.
- He frames the expected dip below the $50 level as a rare short-term window to accumulate silver at a much lower price, saying to 'back up the truck' if it gets there.
Vermeulen reads silver's bounce with Fibonacci levels (chart ratios used to project price targets) and sees a drop toward $40. He argues a market event could trigger margin calls (forced selling by traders who borrowed to buy), pushing silver sharply lower. The speaker expects any $40 touch to last minutes or hours before silver rebounds into the $60 range. He frames that brief dip as a window to accumulate physical silver at a much lower price.

Gold to $8,500 After a Brutal Pullback? Chris Vermeulen’s Warning for Metals
- Top takeaway The guest's Fibonacci work on gold points to a decline toward $3,600 — potentially in the next week or two as of the July 2, 2026 recording — and he expects any slide to be very short lived, a huge lower wick followed by a sharp rebound.
- On silver he expects a fast, violent Fibonacci-driven drop toward $40 an ounce, which may tag that level for only minutes or hours before bouncing back into the $60 range, and he notes platinum and palladium are showing similar chart patterns.
- His longer-term case has gold near $8,500 if the super-cycle holds, easing to roughly $8,100 if it first pulls back to $3,600, which he frames as about 30% more potential upside from that lower level.
- Before treating the gold downtrend as broken he wants to see an impulse move through two resistance levels, which he puts at about $4,600, followed by a pause that creates a higher high and then a higher low.
- He calls Bitcoin a bear market with all major moving averages sloping down, and a Fibonacci target of about $45,000, roughly a 20% haircut, while warning there is no buyer interest in that market right now.
The guest sees gold's short-term trend pointing to a sharp slide toward $3,600, a level he expects to be brief. Above that, he maps a potential impulse breakout near $4,600 and a first pullback as the better place to add physical metal. Silver, platinum and palladium share similar charts, with a fast, violent drop toward $40 framed as a short-lived buying window. Watch for an impulse move through two resistance levels: the first pause afterward is the entry before the next leg. Equities look unresolved, so he liquidated his S&P 500 and QQQ positions and is waiting for a new buy signal before re-entering.

Defensive Stocks Are Sending a Signal
- Top takeaway As of July 2026, Vermeulen argues that big money rotating into defensive sectors (health care, consumer staples, utilities) is an early warning sign for the broader market.
- He sees the dollar breaking out as a further warning signal alongside the defensive rotation.
- He reads weakness in the stock market directly from the price charts, with the Nasdaq among the names showing it.
- He points to gaps and sharp pops and drops as evidence of increased volatility, with big bouts of both selling and buying.
- His conclusion is that markets are weak and still deciding on direction, so investors need to stay aware.

$3,400 Gold Before the Real Rally Begins
- Top takeaway Expects gold to correct into the $3,300-$3,800 zone, the 38-50% Fibonacci retracement of the post-2015 rally, with $3,600 the key level - about 11% below the market as of the June 2026 conference - and argues the drop is a healthy reset that unwinds the late-buyer blow-off.
- Projects the next major advance at roughly $8,000-$8,600 an ounce over the next couple of years, about a double from $3,600, saying his 10-year and two-year cycle targets point to the same price.
- Says he sold out of gold above $5,000 and silver at $111 and is waiting for these technical levels to re-enter precious metals as a long-term buyer, possibly within days to a few months given current volatility.
- Argues the selloff is a shakeout of late buyers: markets "shake you out or wait you out" - as in gold's post-2011 correction, which took about 14 years to break out - and turn higher right when most investors give up.
- Says gold is oversold only on short swing-trading timeframes after the latest new low; for a long-term investor the true oversold, accumulate-and-stack zone is $3,600 down to $3,300.
Vermeulen argues gold's ongoing selloff is a healthy multi-wave correction designed to shake out late buyers before the long-term bull market resumes. He projects a pullback into $3,300-$3,800, where Fibonacci retracement levels (support zones measured from the prior rally) mark the buy area. Fibonacci extension projections put gold at $8,000-$8,600 per ounce over the next couple of years, roughly a double from $3,600. With the long-term trend up but short-term momentum down, Vermeulen says investors should wait for his targets rather than trade bounces. He reports exiting gold above $5,000 and silver at $111, planning to re-enter and accumulate when precious metals hit his support levels.

Why This Gold Pullback Could Create a HUGE Opportunity
Vermeulen views the renewed U.S. dollar strength as a short-term headwind pressing gold toward a potential $3,300 retest. He expects silver to flush toward $40 to complete its post-parabolic correction, creating a buying opportunity for patient investors. Despite near-term downside risks across broader markets, he remains confident in the long-term bull market for precious metals.

Gold & Silver Warning! A Major Move Is Now Imminent | Chris Vermeulen
- Top takeaway Vermeulen argues gold and silver are at a make-or-break turning point as of mid-June 2026: gold must hold the $4,000 level or could drop quickly toward $3,600 (about a 15% haircut), while silver must hold roughly $61 or could fall about 40% to around $40 an ounce.
- If the metals hold their recent lows, his Fibonacci-based super-cycle targets point to roughly $8,600 gold and about $175 silver in one final euphoric blow-off move, which he expects to unfold as a broader financial reset hits.
- He draws a parallel to 2007: he expects one more euphoric push in an AI-driven stock market while gold builds a base, then capital rotating out of stocks should propel metals sharply higher.
- He flags the US dollar as the single most important indicator — it is testing resistance and carving a bottom formation, and a strong breakout would likely break gold's $4,000 support and pressure metals lower near term.
- He says he sold his gold and silver into the early-2026 peak and owns no physical metals now, feeling exposed; he will re-enter either on a fresh technical buy signal or at a sharp discount, which he would consider 'a steal'.
Vermeulen says gold must hold $4,000 and silver roughly $60-61; losing those levels opens quick drops toward $3,600 and $40. A Fibonacci-based bullish path targets roughly $8,600 gold and $175 silver, but only if current lows hold and the US dollar rolls over. He flags the US dollar as the key inverse indicator: a dollar breakout would likely break metals' critical support and pressure prices lower. He compares today to 2007, expecting one final euphoric AI-driven equity push before money rotates into precious metals during a broader reset. Having sold near the peak, he stays long-term bullish and will re-enter on either a deep discount or a fresh technical buy signal.

Critical Turning Point For Gold & Silver | Chris Vermeulen
- Top takeaway The guest argues markets are at a make-or-break turning point, with the next couple weeks of trading (as of June 2026) deciding whether metals and stocks move up or down short term.
- He calls gold's $4,000 level very critical, and says if gold breaks below it, he expects a very quick drop to $3,600.
- On silver, he says the metal really needs to hold $61 per ounce, but a break below $60 would likely trigger a quick drop to around $40 — roughly a 40% haircut from its then-current price.
The guest frames current trading as a make-or-break turning point for the next major move in metals and stocks. Gold holding the $4,000 level is critical; the guest warns a break below could drop it quickly to $3,600. Silver needs to hold $61 per ounce, with a break of $60 risking a fast 40% fall toward $40. The next couple weeks of trading are presented as decisive for the short-term direction of metals.

🚨 Why Most Investors Buy High and Sell Low? Chris Vermeulen Explains #shorts
Vermeulen warns that parabolic price moves punish late buyers who chase momentum rather than follow a defined strategy. Sharp corrections frequently follow parabolic rallies, trapping emotional traders who bought based on excitement. Markets often test investor conviction before continuing higher, making disciplined entry points critical.
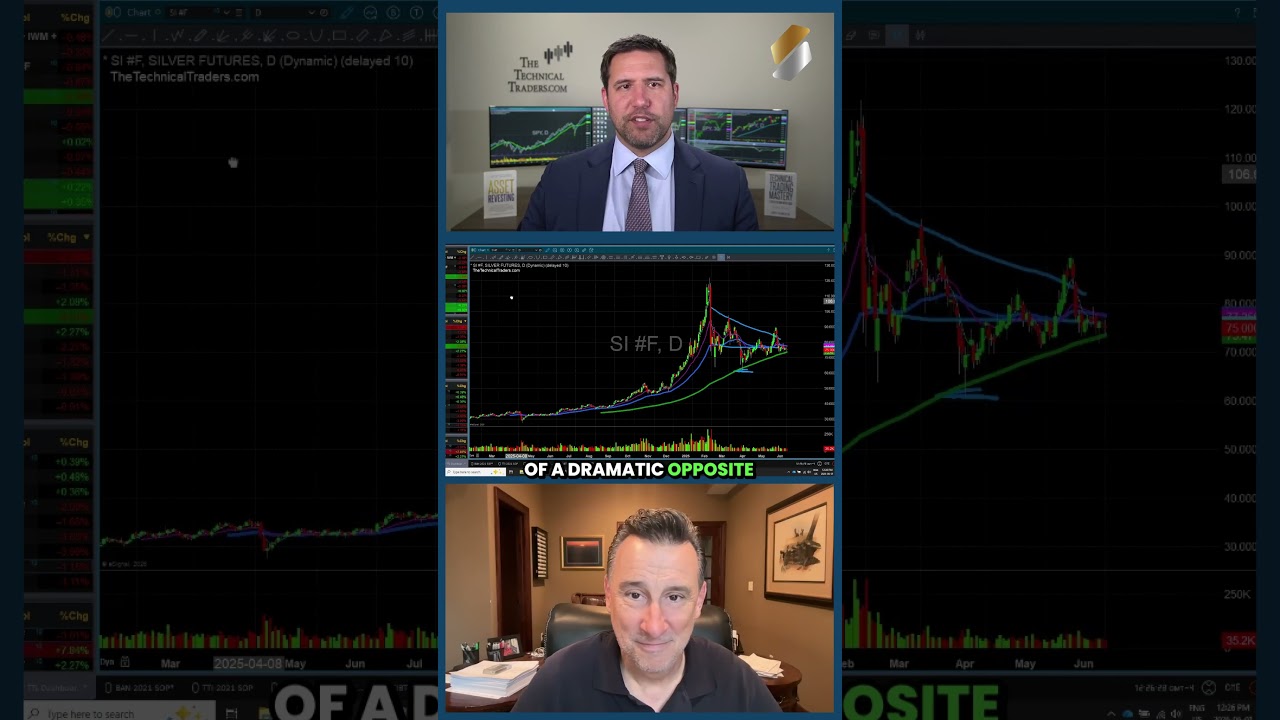
🚨 Silver's Next Target: $175? Chris Vermeulen Explains #shorts
Chris Vermeulen identifies silver's long-term technical target at $175 per ounce based on Fibonacci extensions. A short-term correction toward $40 per ounce remains possible before the next major price advance. Fibonacci extensions (a technical tool using key ratios to project price targets) suggest substantial upside potential for silver.
Key Quotes
"Gold is setting up for a parabolic bubble phase, but investors need to be prepared for a big pullback before the next leg higher."
— YouTube interview on financial reset and gold market dynamics
"We are witnessing a massive financial reset. Hard assets like gold and silver are going to be the primary beneficiaries of the destruction of fiat currency."
— Macro-market analysis on The Technical Traders
"Gold is signaling a financial reset is upon us"
— Jerusalem Post interview
"The market is primed for significant movement, whether upward or downward"
— Palisades Gold Radio interview
Key Works
A subscription-based research service providing technical analysis, active trading signals, and ETF portfolio management focused on precious metals and broad market trends.
Detailed technical research reports covering gold, silver, miners, and major indices, focusing on price phases and momentum to forecast major market moves.
Analysis of dollar rally potential and energy sector divergence
Technical analysis of precious metals and energy market dynamics
Specializations
Disclaimer: Chris Vermeulen has NOT endorsed this platform and is not affiliated with Pixys in any way.