Harmony Gold Mining Company Limited
HMYHarmony Gold Mining Company Limited is a major South African gold producer with a significant operational footprint in South Africa and a high-grade growth asset in Papua New Guinea (PNG). Following the strategic acquisition of South African assets from AngloGold Ashanti and the successful ramp-up of the Hidden Valley mine, Harmony has solidified its position as one of Africa's largest gold miners. The company's portfolio is characterized by deep-level, mature underground mines in the Witwatersrand Basin and open-pit operations.
The company's investment thesis centers on its Hidden Valley operation and the world-class Wafi-Golpu copper-gold project in PNG, which provides substantial long-term growth potential. However, the thesis is counterbalanced by the inherent challenges of deep-level mining in South Africa, including safety risks, high costs, and power supply uncertainties. Harmony's cost structure has improved in recent years, but it remains sensitive to gold price fluctuations due to the high operating costs associated with its South African operations.
Jurisdictional risk is a primary concern for investors. While South Africa presents well-documented challenges related to infrastructure (power grid issues via Eskom) and regulatory complexity, the company's PNG exposure introduces additional geopolitical and community engagement risks. The successful development of Wafi-Golpu is critical for Harmony's long-term reserve life and production profile, but it requires navigating complex permitting and partnership dynamics.
Financially, Harmony maintains a moderate balance sheet, leveraging strong free cash flow generation at current elevated gold prices to manage debt levels incurred from acquisitions. The stock offers leveraged exposure to the gold price, trading at a discount to North American and Australian peers, largely reflecting its jurisdictional and operational risk profile. Investors must weigh the potential for significant re-rating upon successful execution of the Wafi-Golpu project against the operational risks of its mature South African asset base.
Data Quality
Market Cap
$163.68B
Total valuation
Stock Price
$15.53
▲ 0.00% today
Free Cash Flow
N/A
Annual
Financial Position
-$849.00M
Net debt position
PEG Ratio
ⓘN/M
Not meaningful
Analysis
Score Interpretation
Hover any criterion below to reveal its full rationale, key metrics, strengths, concerns, and source documentation.
Criterion Detailed Analysis
Recommendation
Harmony Gold is a highly leveraged play on the gold price, trading at a significant discount to global peers due to its concentrated exposure to South Africa's deep-level mining challenges and jurisdictional risks. While the company controls a vast resource base and generates substantial free cash flow at current gold prices, its structurally high cost structure and reliance on Eskom power present ongoing operational headwinds.
The primary catalyst for re-rating is the advancement of the Wafi-Golpu project in PNG, which offers transformative growth potential but remains years away from production. Investors with a strong conviction in higher gold prices and a tolerance for emerging market jurisdictional risks may find the valuation compelling, but the stock requires careful monitoring of South African operational metrics and PNG development milestones.
Red Flags
| Criterion | Severity | Score | Description |
|---|---|---|---|
| jurisdiction | High | 2.50 | Primary operations in South Africa (Tier 5) expose the company to extreme power grid instability, labor unrest, and complex regulatory requirements. |
| cost_structure | Medium | 5.00 | High AISC structurally disadvantages the company; margins compress rapidly if gold prices decline. |
| infrastructure | Medium | 4.00 | Deep-level mining requires massive, uninterrupted power for safety; Eskom load-shedding poses a persistent operational threat. |
Scenario Analysis
Bull Case
Gold prices sustain above $2,800/oz, significantly boosting FCF and accelerating deleveraging. Wafi-Golpu receives final permits, unlocking substantial value.
Base Case
Gold prices remain stable around $2,650/oz. Operations continue with intermittent power challenges. Wafi-Golpu advances slowly through permitting.
Bear Case
Gold prices fall below $2,000/oz, compressing margins and straining the balance sheet. Severe Eskom power cuts force production shutdowns.
Audit Trail
| # | Source |
|---|---|
| 1 | Integrated Annual Report 2024: Financial statements, operational metrics, reserve declarations |
| 2 | Mineral Resource and Reserve Declaration: Resource estimates for SA and PNG operations |
| 3 | Wafi-Golpu Pre-Feasibility Study: Development timeline and capital estimates |
| 4 | Market Data: Current share price, metal prices, trading volumes |
Financials
Core Metrics
Annual Production
N/A
Troy oz per year
Revenue
N/A
Fiscal year 2026
Net Income
-$321.00M
Annual
Enterprise Value
$164.53B
Net debt: $400.00M
Adj. EBITDA
$1.50B
EV/EBITDA 109.69x
Income & Cash Flow
Waterfall · Revenue to Free Cash Flow
Key P&L Ratios
N/A
Free Cash Flow Generated
Balance Sheet & Leverage
Capital Structure
- Equity $2.50B
- Long-Term Debt $0.00
- Short-Term Debt $0.00
- Cash & Equivalents $51.00M
Leverage & Coverage
$400.00M
Net Debt (Strong)
Cash Uses & Returns
- Capital Expenditures $450.00M
- Dividends Paid $120.00M
- Share Buybacks $0.00
- Interest Expense $0.00
- Debt Repayment / Other $630.00M
Profitability & Returns
Returns
Margins
Liquidity & Coverage
Yield
Valuation
Valuation Multiples
Share Structure & Ownership
Share Structure
- Outstanding 600.00M 600.00M
- Options 10.00M 10.00M
- RSUs 15.00M 15.00M
- Warrants 0.00 0.00
Per-Share & Buyback Metrics
$0.00
Remaining Buyback Capacity
Health Indicators
Strength across all solvency and liquidity metrics
36.0% of 1.0x threshold
9.0% of 3.0x threshold
87.7% of 3.0x target
69.4% of 48 months target
28.0% of 15% threshold
Asset Pipeline
Jurisdiction Exposure
Geographic distribution of mining properties · Equal-weighted (no NPV data)
- Papua New Guinea50.0% · Tier 4 · 2 properties
- South Africa50.0% · Tier 5 · 2 properties
Operating Mines
Distribution across development stages · Equal-weighted (no NPV data)
- Production (Steady-State)75.0% · 3 Assets
- Feasibility Study25.0% · 1 Asset
Cost Structure
All-in Sustaining Cost (AISC) breakdown • Cost improvement opportunity
$1,650/oz • 100%
Hidden Valley
Moab Khotsong
Mponeng
Wafi-Golpu
Information
Key Information
Legal Entity
Harmony Gold Mining Company Limited
Sector
Precious Metal
Founded
May 17, 1994
Employees
34,715
Reporting Currency
USD
Contact Phone
27 11 411 2000
Website
www.harmony.co.zaHeadquarters Address
Randfontein Office park , Randfontein 1759 , ZA
Identifiers
Commodity Portfolio
Organization
Management Team
Peter Steenkamp
Chief Executive Officer
Insider Ownership
15.00%
Boipelo Lekubo
Chief Financial Officer
Insider Ownership
2.00%
Industry Partnerships
Newmont Corporation
Joint Venture
Project: Wafi-Golpu
Ownership: 50.0%
Source: Joint Venture Agreements, Annual Report
Partner Market Cap
$45.00B
Chart
Interactive chart powered by TradingView. Use the chart tools to analyze price trends.
Videos
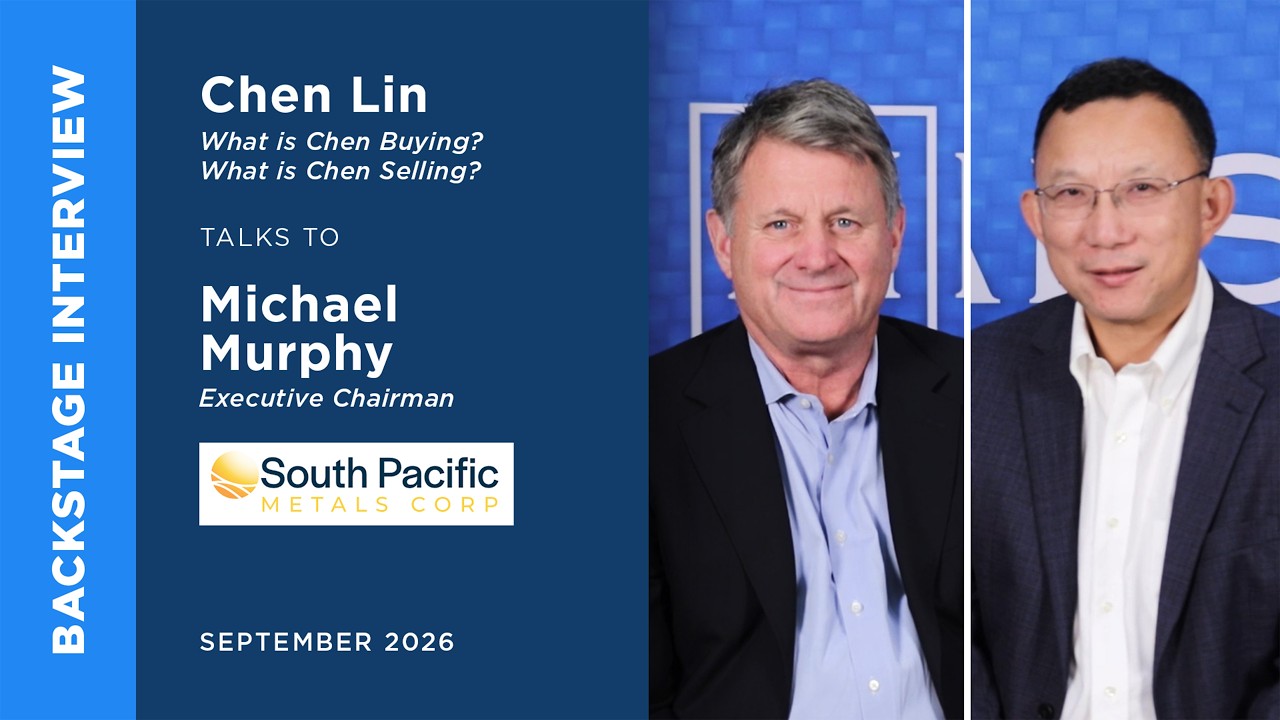
Michael Murphy of South Pacific Metals Corp. talks to Chen Lin | Metals Investor Forum Sept. 2026
Key Highlights
detailed- Murphy says Harmony held the project for years, spent about $20 million US and drilled 37,000 meters before deciding to leave roughly 8-9 years ago due to social license issues.
- Harmony defined the central porphyry and modeled a 4-million-ounce resource going down to about 600 meters, though it drilled to about 1,600-1,800 meters.
- Murphy points to results outside that resource: an 8-meter intersection of 13% copper with 12 g/t gold, and some 50 samples around the porphyry averaging 1.7% copper with values up to 27%.
A BMO-led $20 million financing, upsized from $15 million, funds South Pacific Metals' drill plans for the foreseeable future, per its chairman. Drilling at the Ontenu project southwest of K92 Mining has hit mineralization on all three structures drilled, echoing K92's high-grade Kora vein geology. South Pacific Metals rebuilt the social license Harmony abandoned at Kili Teke, where past drilling outlined a 4-million-ounce gold-equivalent inferred resource. Papua New Guinea's single certified assay lab is creating a backlog, so drill-result news flow may lag despite two rigs turning. Kili Teke drilling is targeted by year-end; exploration licences allow 2,500 metres of drilling before a roughly three-month environmental permit applies.

Janine Goh of South Pacific Metals Corp. presents at Metals Investor Forum in Vancouver | Sep 2026
Key Highlights
brief- Mentioned once, as the counterparty on an asset sale: the presenter says Kiliteke was 'That we acquired from Harmony Gold'. The 4.2 million ounce gold equivalent figure attached to Kiliteke is the acquiring company's claim about an asset it now owns, not a Harmony holding, and no Harmony operations or results are discussed.
Two Papua New Guinea copper-gold projects anchor the pitch: Osina, beside K92's K-9-2 mine, and Kiliteke's 4.2 Moz gold-equivalent inferred resource. Management's Megaby drilling: 300+ m of strike open in all directions, a 38.7 g/t peak assay, and high-grade zones still open down plunge. Kiliteke's first assay batch found a massive sulfide body extending over 200 m, with outcrop samples to 12% copper; 600 kg await assays. An unfiltered stage pitch: no analyst pushback, a mid-presentation 'Standard disclosure' line, and every figure is management's own claim. Funding is staged: roughly 70 million shares, 45% with insiders, and a BMO-led marketed financing of up to 15 million.

Jason Attew, President & CEO of OR Royalties | Rule Symposium 2026: Rick Rule interviews
Key Highlights
brief- OR Royalties' third most important asset is the CSA mine in Australia, which the guest describes as the highest-grade underground copper mine in the country.
- Attew notes Harmony Gold bought CSA, formerly a Glencore mine, in 2025.
OR Royalties holds royalties rather than streams in safe jurisdictions, earning near-97% cash margins because royalty holders receive revenue without paying mine costs. Its cornerstone royalty is a 5% NSR (net smelter return — a cut of mine revenue) on Canadian Malartic, with operator guidance of life to 2060. CEO Jason Attew grades every acquisition on a per-share basis and walked away from 2025's $9.3 billion royalty deal wave rather than overpay for scale. Four early-2026 royalty deals — from Gold Fields, in Ghana, and at Nevada's Spring Valley — deploy about $500 million from a debt-free balance sheet. Attew argues OR still trades below mid-tier and senior peers on most financial metrics, with catch-up expected as commodity-price-adjusted per-share growth delivers.
Articles
No articles available
Published articles for this company will appear here
Want the full picture on more companies?
Be one of the first.
A room for resource investors taking shape now — independent, spam-free, no hype.