
Gold Fields Limited
GFIGold Fields Limited (GFI) is a globally diversified gold producer with a strong portfolio of operations spanning South Africa, Ghana, Australia, Peru, and Chile. Following the transformative acquisition of Yamana Gold in 2023, the company has solidified its position as a top-tier global gold major, boasting a highly diversified asset base that mitigates single-asset and single-jurisdiction risk. The company is focused on generating robust free cash flow from its established operations, including the highly mechanized South Deep mine in South Africa and the expanding Salares Norte operation in Chile.
Operationally, Gold Fields demonstrates competitive cost structures and disciplined capital allocation. The management team, led by CEO Mike Fraser, is actively transitioning the company's portfolio weighting toward more favorable Tier 1 and Tier 2 jurisdictions while optimizing the performance of its legacy Tier 3 and Tier 5 assets. The successful ramp-up of the Salares Norte gold-silver mine in Chile is a critical near-term catalyst, expected to significantly boost the company's overall production profile and lower all-in sustaining costs (AISC) due to the high-grade nature of the deposit.
Financially, Gold Fields maintains a healthy balance sheet characterized by manageable leverage and strong operating cash flow generation. This financial flexibility allows the company to sustain a competitive dividend yield, fund organic growth projects, and pursue value-accretive M&A opportunities without jeopardizing its investment-grade credit ratings. The stock offers investors a compelling mix of stability, growth, and exposure to the gold price, trading at a reasonable valuation relative to its senior gold producer peers.
However, investment risks remain, primarily centered around jurisdictional challenges. The company retains significant exposure to operational and political risks in South Africa (Tier 5) and Peru (Tier 3). Additionally, the integration and ramp-up risks associated with the Salares Norte project, particularly concerning water access and high-altitude operations, require close monitoring. Despite these challenges, Gold Fields' diversified portfolio and strong cash-generating capabilities position it well to capitalize on a favorable gold price environment.
Data Quality
Market Cap
$474.39B
Total valuation
Stock Price
$32.24
▼ 1.26% today
Free Cash Flow
N/A
Annual
Financial Position
-$1.76B
Net debt position
PEG Ratio
ⓘN/M
Not meaningful
Analysis
Score Interpretation
Hover any criterion below to reveal its full rationale, key metrics, strengths, concerns, and source documentation.
Criterion Detailed Analysis
Recommendation
Gold Fields (GFI) is a solid, diversified major gold producer offering investors a balanced mix of stability, growth, and competitive valuation. The company's strong portfolio of global assets, anchored by the massive South Deep mine and the high-growth Salares Norte project, provides a reliable production base and significant organic growth potential. The stock is attractively valued, trading at a discount to its NAV and offering a healthy free cash flow yield.
However, the investment case is tempered by significant jurisdictional risks, particularly the company's exposure to South Africa's challenging operating environment and political uncertainties in Peru. While management is actively mitigating these risks through geographic diversification, they remain a drag on the company's valuation. The successful ramp-up of Salares Norte is critical; a smooth transition to steady-state production will likely serve as a positive re-rating catalyst. Overall, Gold Fields is a quality gold major suitable for investors seeking leveraged exposure to the gold price with a moderate risk profile.
Red Flags
| Criterion | Severity | Score | Description |
|---|---|---|---|
| jurisdiction | High | 5.50 | Significant exposure to Tier 5 (South Africa) and Tier 3 (Peru, Chile) jurisdictions introduces political, operational, and infrastructure risks. |
| management_team | Low | 7.00 | CEO Mike Fraser is relatively new to the position, having taken over in 2024, which introduces a degree of execution risk during the leadership transition. |
Scenario Analysis
Bull Case
Bull case assumes gold prices exceed $3,000/oz driven by aggressive central bank buying and a weak US Dollar. Salares Norte successfully ramps up to full capacity, significantly boosting production and lowering consolidated AISC. Political conditions in South Africa stabilize, leading to a re-rating of the stock's jurisdictional discount.
Base Case
Base case assumes gold prices remain stable around $2,650/oz. The company meets production guidance and Salares Norte ramps up according to plan with minor delays. The stock provides a steady dividend yield and modest capital appreciation.
Bear Case
Bear case assumes a drop in gold prices below $2,200/oz due to a strong global economy and rising real interest rates. Operational challenges at Salares Norte persist, and escalating infrastructure or political crises in South Africa severely impact production and costs.
Audit Trail
| # | Source |
|---|---|
| 1 | Gold Fields 20-F Annual Report (2023): Financial statements, properties, operational data |
| 2 | NI 43-101 Technical Reports: Resource estimates for South Deep, Salares Norte, and Australian assets |
| 3 | Q4 2024 Trading Statement: Preliminary production and cost figures |
| 4 | Company IR Presentations (2024): Management strategy, project updates, reserve data |
Financials
Core Metrics
Annual Production
N/A
Troy oz per year
Revenue
$6.10B
Fiscal year 2026
Net Income
-$345.00M
Annual
Enterprise Value
$476.15B
Net debt: $1.20B
Adj. EBITDA
$3.50B
EV/EBITDA 136.04x
Income & Cash Flow
Waterfall · Revenue to Free Cash Flow
Key P&L Ratios
N/A
Free Cash Flow Generated
Balance Sheet & Leverage
Capital Structure
- Equity $8.80B
- Long-Term Debt $0.00
- Short-Term Debt $0.00
- Cash & Equivalents $440.00M
Leverage & Coverage
$1.20B
Net Debt (Strong)
Cash Uses & Returns
- Capital Expenditures $870.00M
- Dividends Paid $400.00M
- Share Buybacks $0.00
- Interest Expense $71.20M
- Debt Repayment / Other $1.86B
Profitability & Returns
Returns
Margins
Liquidity & Coverage
Yield
Valuation
Valuation Multiples
Share Structure & Ownership
Share Structure
- Outstanding 895.00M 895.00M
- Options 10.00M 10.00M
- RSUs 15.00M 15.00M
- Warrants 0.00 0.00
Per-Share & Buyback Metrics
$0.00
Remaining Buyback Capacity
Health Indicators
Strength across all solvency and liquidity metrics
25.0% of 1.0x threshold
11.4% of 3.0x threshold
64.7% of 3.0x target
50.0% of 48 months target
18.7% of 15% threshold
Asset Pipeline
Jurisdiction Exposure
Geographic distribution of mining properties · Equal-weighted (no NPV data)
- Peru20.0% · Tier 3 · 1 property
- Australia20.0% · Tier 1 · 1 property
- Chile20.0% · Tier 2 · 1 property
- South Africa20.0% · Tier 5 · 1 property
- Ghana20.0% · Tier 3 · 1 property
Operating Mines
Distribution across development stages · Equal-weighted (no NPV data)
- Production (Steady-State)80.0% · 4 Assets
- Production (Ramp-Up)20.0% · 1 Asset
Cost Structure
All-in Sustaining Cost (AISC) breakdown • Peer-leading efficiency
$1,350/oz • 100%
Cerro Corona
Granny Smith
Salares Norte
South Deep
Tarkwa
Information
Key Information
Legal Entity
Gold Fields Limited
Sector
Precious Metal
Founded
March 17, 1980
Employees
6,560
Reporting Currency
USD
Contact Phone
27 11 562 9700
Headquarters Address
150 Helen Road , Sandton 2196 , ZA
Identifiers
Commodity Portfolio
Liquidity
- Avg dollar volume (50d)
- —
- Last trade date
- 7/29/2026
- Days since last trade
- 48
- Last evaluated
- 2026-09-15 22:30:20
Stock Exchanges
Organization
Management Team
Mike Fraser
Chief Executive Officer
Insider Ownership
5.00%
Martin Preece
Chief Operating Officer
Insider Ownership
2.00%
Industry Partnerships
AngloGold Ashanti
Joint Venture
Project: Iduapriem Mine
Ownership: 50.0%
Source: 10-K, Joint Venture Agreements
Partner Market Cap
$10.00B
Chart
Interactive chart powered by TradingView. Use the chart tools to analyze price trends.
Videos
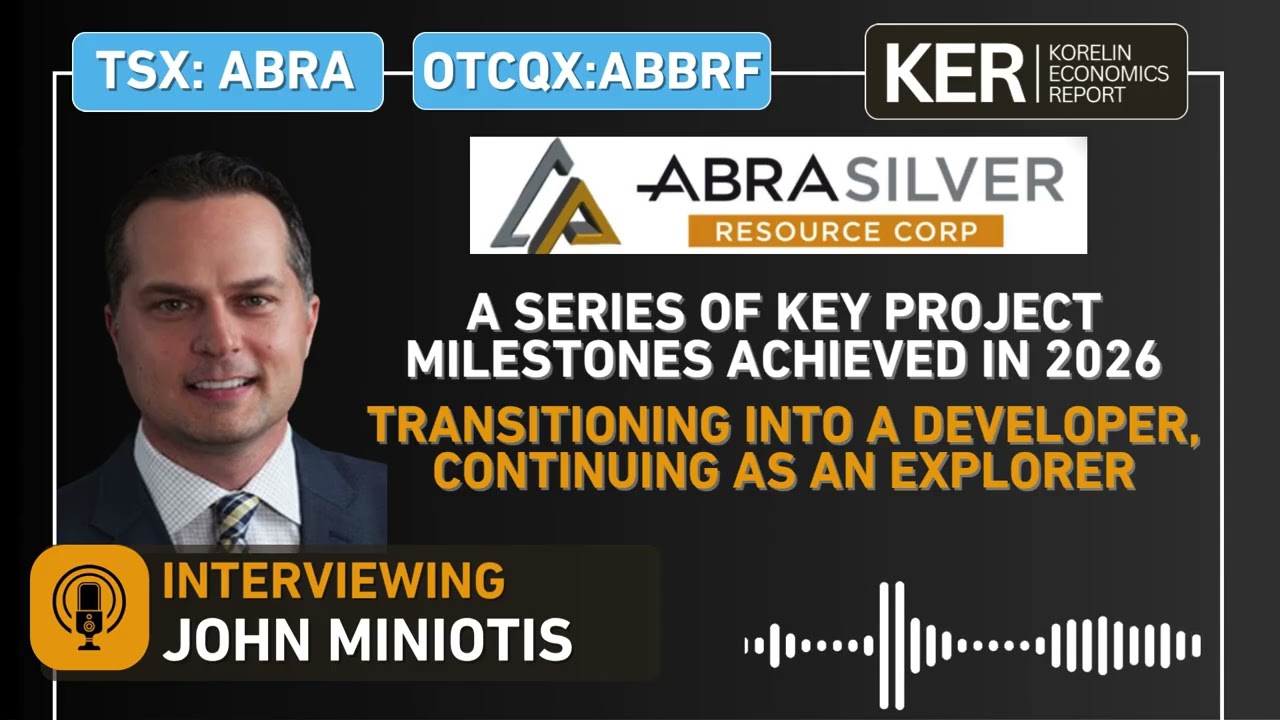
AbraSilver Resource– A Series Of Key Project Milestones Achieved in 2026, Transitioning To Developer
AbraSilver has cleared its 2026 milestones with RIGI approval, environmental permits from both provinces, an updated MRE, and a DFS, fully transitioning Diablillos to active developer. The June DFS shows a 3B base case after-tax NPV at a 41.9% IRR and 20/oz AISC, placing Diablillos among the lowest-cost silver projects globally. A July 50M raise including a Kinross placement funds early works; a larger debt/stream package is targeted before year-end ahead of a Q2 2027 FID. New Executive Chair Marie Inkster, COO Jeremy Weyland, Project Director John Naisbitt, and Director Wendy Kaufman add construction expertise to the team. A Phase 2 PEA on heap leaching 130Mt of previously classified waste, plus throughput doubling studies, point to upside beyond the base case DFS.

'Never Been More Bullish' - 'Unbelievably CHEAP' Gold & Silver Stocks Set to Rip
John Feneck and Don Durrett see massive undervaluation in gold and silver stocks, describing them as unbelievably cheap and set to rip higher. The experts open up their portfolios to reveal top stock picks in the precious metals sector they believe are currently on sale. Discussion covers the macro backdrop for precious metals, geopolitical risks like the Iran war, and specific gold and silver stocks to watch.

Founders Metals - Antino Project: Expanding Gold Mineralization & The Project To 100,000 Hectares
High-grade 'kicks' within Lower Antino's broad 90-meter intercept at 1.02 g/t gold signal a bulk-tonnage target with significant room to grow. Antino's expansion to 100,000 hectares consolidates an entire Suriname greenstone belt (ancient volcanic rock that hosts large gold systems), giving Founders Metals district-scale optionality. A $55 million treasury and $35–$37 million 2026 exploration budget let Founders Metals drill aggressively across the expanded district. Founders ranks Upper Antino first for resource work, then Lower Antino, then a 5 km northern auger anomaly (a soil-sampling target) — the property's largest.
Articles
No articles available
Published articles for this company will appear here
Want the full picture on more companies?
Be one of the first.
A room for resource investors taking shape now — independent, spam-free, no hype.